Softagram brings visual pull request analysis to GitHub Marketplace
Unique visual analysis of the changes and impact of pull requests speeds up code reviews and eliminates architecture drawbacks.
For an effective code review, one must use their time to thoroughly understand the change - the changed functionality; all added, removed and changed dependencies; and the impacted modules.
Imagine if all those could be visualized automatically!
Now it's possible to activate Softagram pull request analysis for any GitHub project (even multi-repository ones). You will get visual change analyses delivered directly to your GitHub pull request's comments.
Make your reviewer's life easier. Activate the Softagram analysis and visualization for your pull requests.
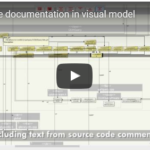
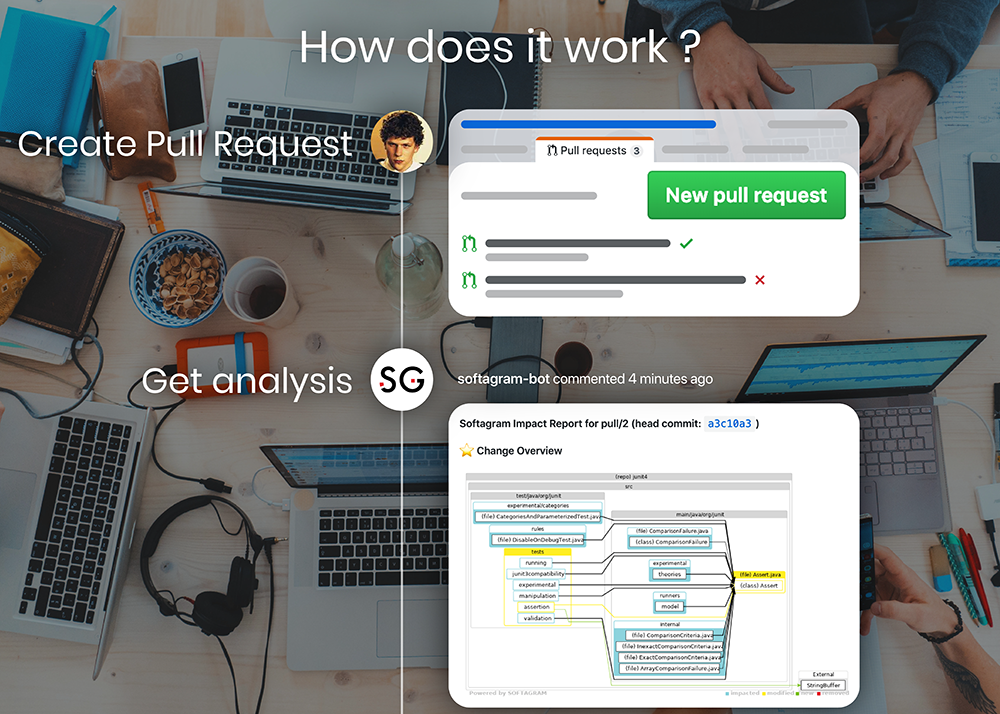
Example? See the short video below:
How to activate?
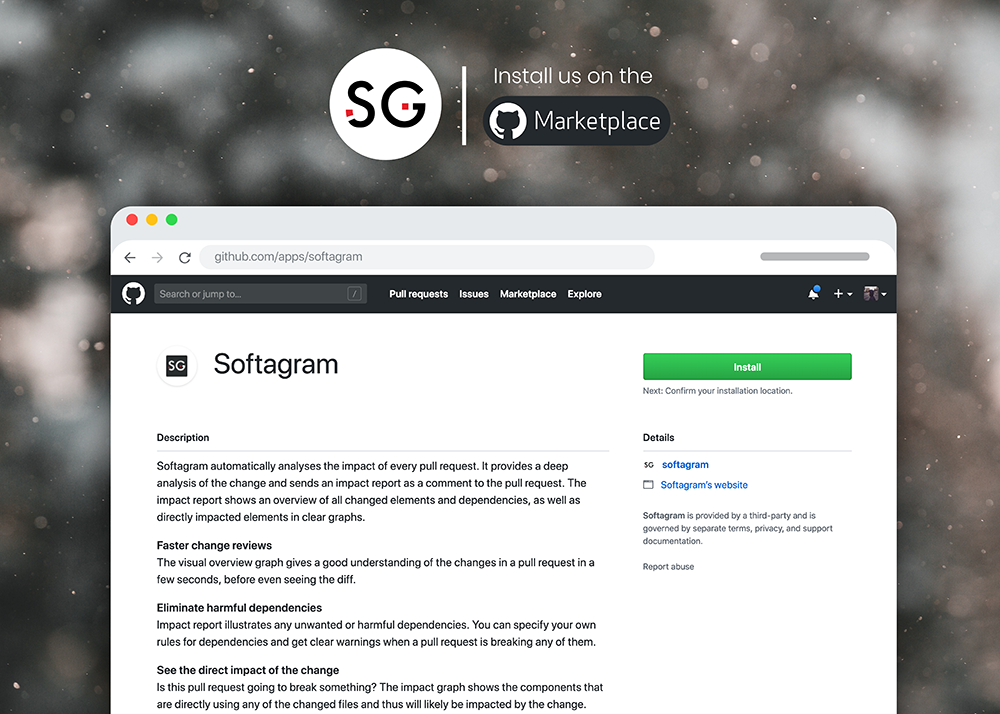
- Go to https://github.com/marketplace/softagram
- Install the free trial, select your repositories and enjoy
Every upcoming pull request in the selected repositories will then receive a compact visual analysis directly in its comment section.
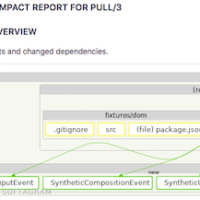
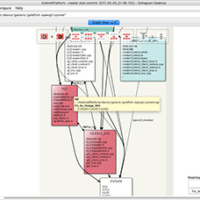
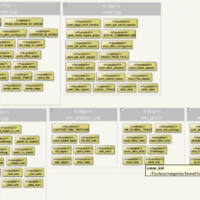
See below for an example of a Facebook/React pull request:
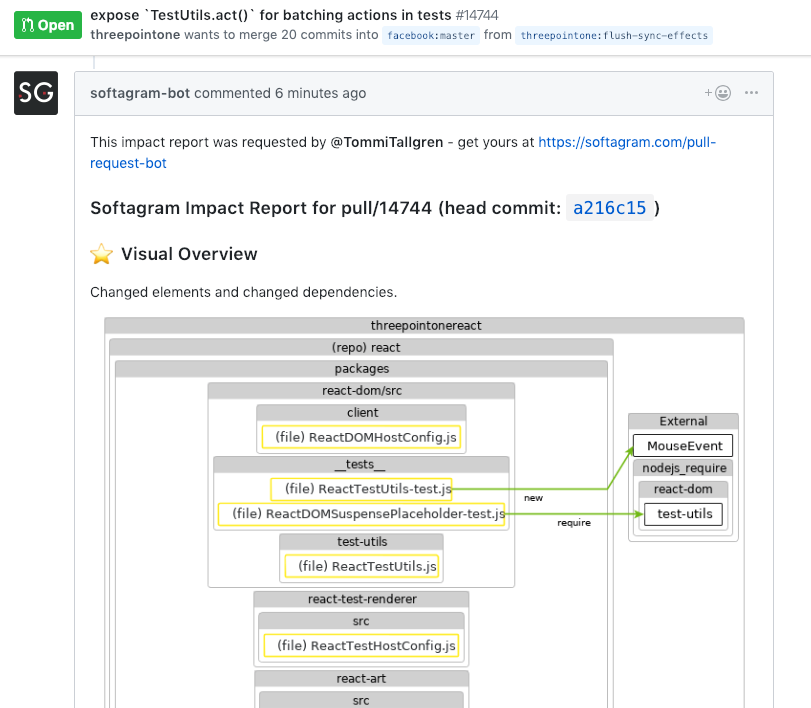
The beginning of a Softagram-bot generated analysis and visualization of pull request in the React repo.
Why do you need pull request visualization?
If your development slows down due having to wait days for someone to accept your change. Or on the other hand, as a reviewer you do not have enough time to read the code and understand the impact of the change. Then you may benefit from a visual analysis of the pull request.
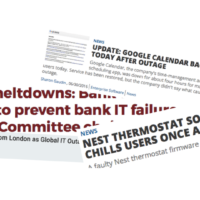
Technical debt is made in small steps. Fast decisions in pull request reviews for bug fixes or feature development cause low-quality merges and increases the burden of maintenance.
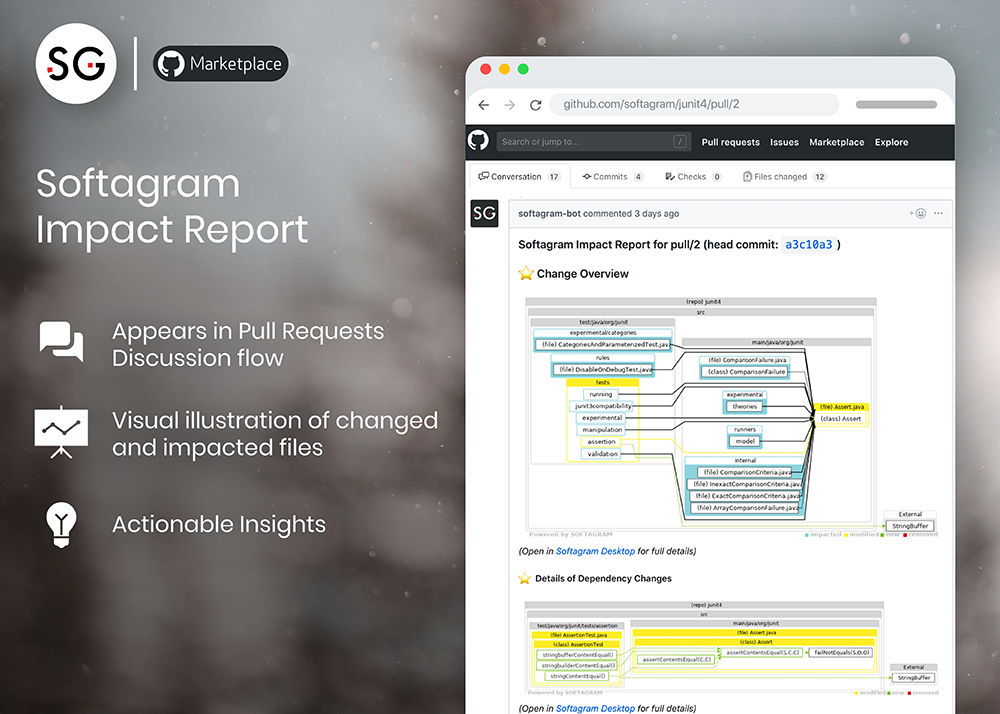 Softagram continuous analytics creates deep analytics from each pull request using machine learning algorithms. The Impact reports show visually the changed files and how the whole system is affected by the change. It focuses on analyzing dependencies and changed dependencies and visualizing them in easy-to-read and informative charts.
Impact Report finds the hidden impact of the change, as well as e.g. unwanted new dependencies or missing unit tests. Based on user-configurable rules, it can automatically create an issue for the contributor to fix before merging.
Benefits of automatically generated analytics for each pull request
Softagram can be added to GitHub, GitLab, Atlassian Bitbucket or Azure DevOps (VSTS/TFS) projects. It supports C, C++, Objective C, Java, JS, TypeScript, Python, PHP, Kotlin (and more) and hundreds of repositories with millions of lines of code.
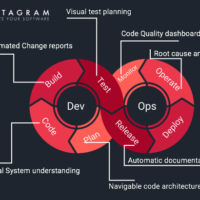
We understand that every change you make to your development process should be evaluated by its ROI. Please see below the ways AI-driven analytics, visualization, and a fully integrated report will change your development process and improve your code.
INCREASE
- Quality of merges and of your software
- The number of pull requests accepted per day, due to automated visual analytics
Note: Visual data is recognized by brain 60 000 times faster than reading the text (code)!
- Software design knowledge due to dependency graphs
DECREASE
- Time of pull request acceptance with the help of clear points to focus attention
- Release cycle time due to faster reviews
- Bad quality code merges with transparency and rules
REMOVE
- Unwanted dependencies that degrade your software architecture!
- Merges without analyzing its impact on the system
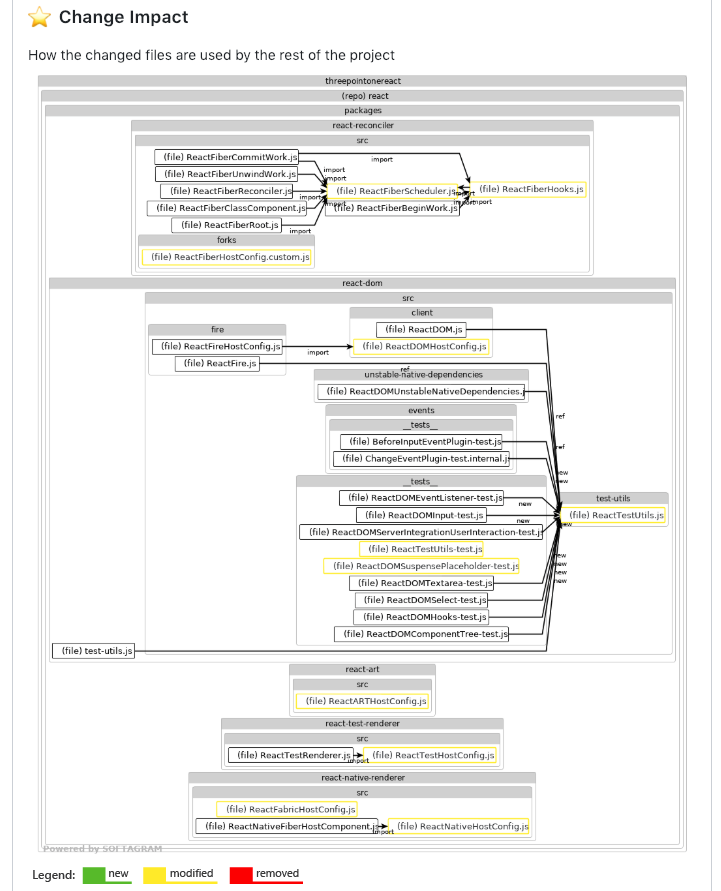
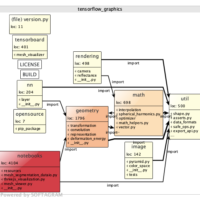
Change Impact visualization in pull request report to Facebook/React project.
Softagram generates data worth multiple man-hours for each pull request. There could be tens to hundreds of reports generated on every single day for active projects! Providing every developer with their daily dosage of dependency awareness in visual form creates a better understanding of the current situation of the design. Visual graphs help to discuss and improve the architecture of your software.
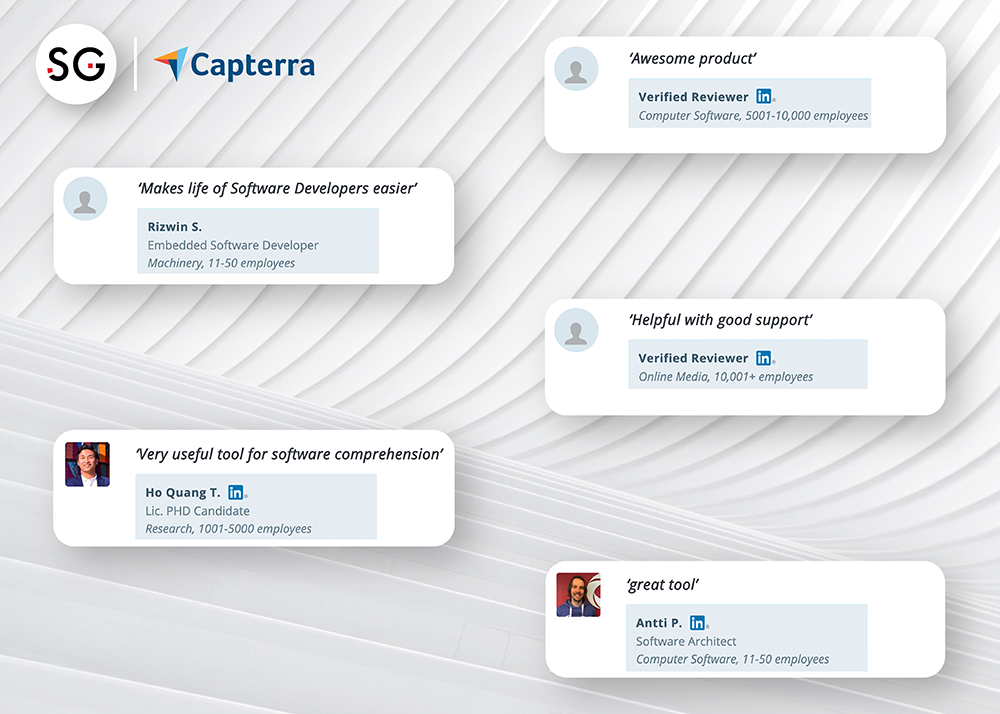
Faster code reviews and increased quality leads to timely releases of your software and happier customers, please see a few reviews from our users below:
Activate pull request analysis for your project.
For private repositories, cloud users can sign in and activate analysis (free trial for the first 2 weeks):
- GitHub users: https://github.com/apps/softagram
- BitBucket/GitLab/Azure DevOps/Gerrit/Helix TeamHub : https://softagram.com/products
Continuous analysis for open source GitHub project is also possible, just contact us via Chat (below right) or email: customersupport@softagram.com to activate it.