To provide the best experiences, we use technologies like cookies to store and/or access device information. Consenting to these technologies will allow us to process data such as browsing behavior or unique IDs on this site. Not consenting or withdrawing consent, may adversely affect certain features and functions.
The technical storage or access is strictly necessary for the legitimate purpose of enabling the use of a specific service explicitly requested by the subscriber or user, or for the sole purpose of carrying out the transmission of a communication over an electronic communications network.
The technical storage or access is necessary for the legitimate purpose of storing preferences that are not requested by the subscriber or user.
The technical storage or access that is used exclusively for statistical purposes.
The technical storage or access that is used exclusively for anonymous statistical purposes. Without a subpoena, voluntary compliance on the part of your Internet Service Provider, or additional records from a third party, information stored or retrieved for this purpose alone cannot usually be used to identify you.
The technical storage or access is required to create user profiles to send advertising, or to track the user on a website or across several websites for similar marketing purposes.
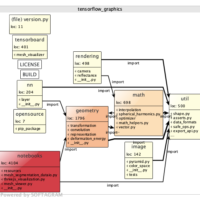
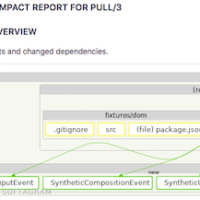
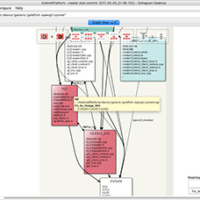
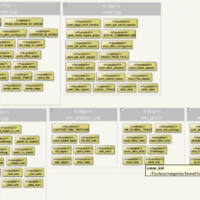
 Softagram continuous analytics creates deep analytics with machine learning algorithms from each pull request. Within the minutes of the pull, “impact report” is added to the pull request notes in your system. Softagram Impact reports show visually the changed files and how the whole system is affected by the change. Softagram utilizes its uniqueness of analyzing the dependencies and change of dependencies and visualizing them in easy to read informative charts.
Softagram Impact Report uses multiple KPIs to rate the pull request risk level and shows the most critical files to focus the attention. It finds the hidden impact of the change, as well as e.g. un_wanted new dependencies or missing unit tests. Based on the rules it can automatically create an issue for the contributor to be fixed before the merge. See a video example of the Softagram impact report.
 INCREASE

