What do you gain with automated analytics for each pull request?
Ville Laitila on January 24, 2018
Why should the analytics for each pull/merge request be automatic?
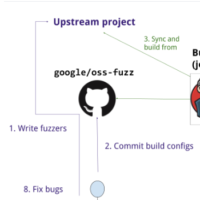
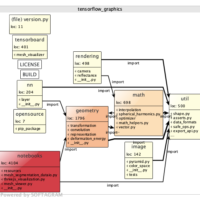
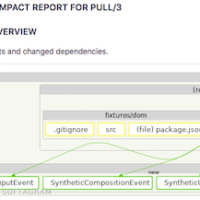
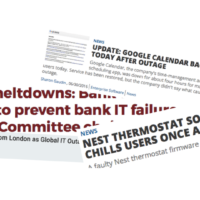
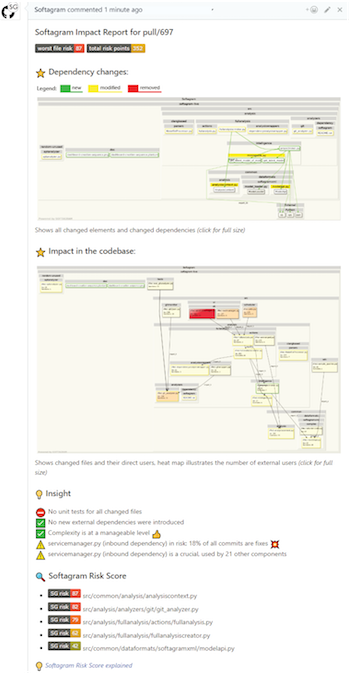
Code reviews and pull request process is a great way to improve the quality of the software. However, they are not as effective as they could be due to the time pressure and lack of automation. Often the development is slowed down due to the need to wait days for someone to accept your change. On the other hand, reviewers have not enough time to read the code and understand the impact of the change. Technical debt is made in small steps. Fast decisions in pull request reviews for bug fixes or feature development causes low-quality merges and increasing maintenance burden.Softagram continuous analyticscreates deep analytics with machine learning algorithms from each pull request. Within the minutes of the pull, “impact report” is added to the pull request notes in your system. Softagram Impact reports show visually the changed files and how the whole system is affected by the change. Softagram utilizes its uniqueness of analyzing the dependencies and change of dependencies and visualizing them in easy to read informative charts.Softagram Impact Report uses multiple KPIs to rate the pull request risk level and shows the most critical files to focus the attention. It finds the hidden impact of the change, as well as e.g. un_wanted new dependencies or missing unit tests. Based on the rules it can automatically create an issue for the contributor to be fixed before the merge. See a video example of the Softagram impact report.
Benefits of automatically generated analytics for each pull request
Every change you’ll make to your process should be evaluated by the ROI. Please see the ways AI drove analytics, visualization and fully integrated report ´will change your process and code.INCREASE
Quality of the merges and your software
The amount of pull request accepted per day, due automated visual analytics
Note: Visual data is recognized by brain 60 000 times faster than reading the text (code)!
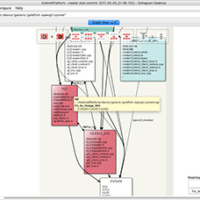
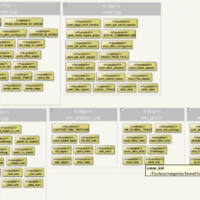
The understanding of the software design due to dependency graphs
DECREASE
Time of pull request acceptance due to clear points to focus the attention
Release cycle time due to faster reviews
Bad quality code merges with transparency and rules
REMOVE
Unwanted dependencies that degrade your software architecture!
Merges without analyzing its impact on the system
Any new code without unit tests
Softagram generates data worth of multiple man-hours for each pull request. There could be tens to hundreds of reports generated on every single day! Providing daily dosage of dependency awareness in visual form for every developer creates a good understanding of the current situation of the design and helps to improve the architecture of your software.Faster code reviews and increased quality leads timely releases of your software and happier customers!
Get all these benefits to your organization, fill the information below for offer and next steps!

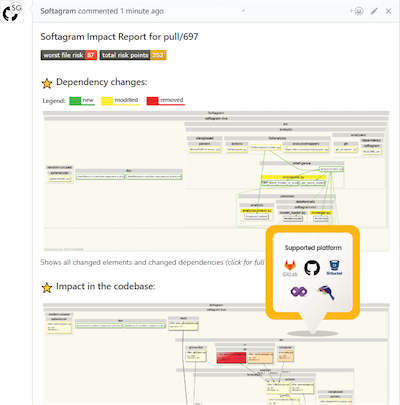 Softagram continuous analytics creates deep analytics with machine learning algorithms from each pull request. Within the minutes of the pull, “impact report” is added to the pull request notes in your system. Softagram Impact reports show visually the changed files and how the whole system is affected by the change. Softagram utilizes its uniqueness of analyzing the dependencies and change of dependencies and visualizing them in easy to read informative charts.
Softagram Impact Report uses multiple KPIs to rate the pull request risk level and shows the most critical files to focus the attention. It finds the hidden impact of the change, as well as e.g. un_wanted new dependencies or missing unit tests. Based on the rules it can automatically create an issue for the contributor to be fixed before the merge. See a video example of the Softagram impact report.
Softagram continuous analytics creates deep analytics with machine learning algorithms from each pull request. Within the minutes of the pull, “impact report” is added to the pull request notes in your system. Softagram Impact reports show visually the changed files and how the whole system is affected by the change. Softagram utilizes its uniqueness of analyzing the dependencies and change of dependencies and visualizing them in easy to read informative charts.
Softagram Impact Report uses multiple KPIs to rate the pull request risk level and shows the most critical files to focus the attention. It finds the hidden impact of the change, as well as e.g. un_wanted new dependencies or missing unit tests. Based on the rules it can automatically create an issue for the contributor to be fixed before the merge. See a video example of the Softagram impact report.
 INCREASE